This article first appeared on the Public Digital blog.
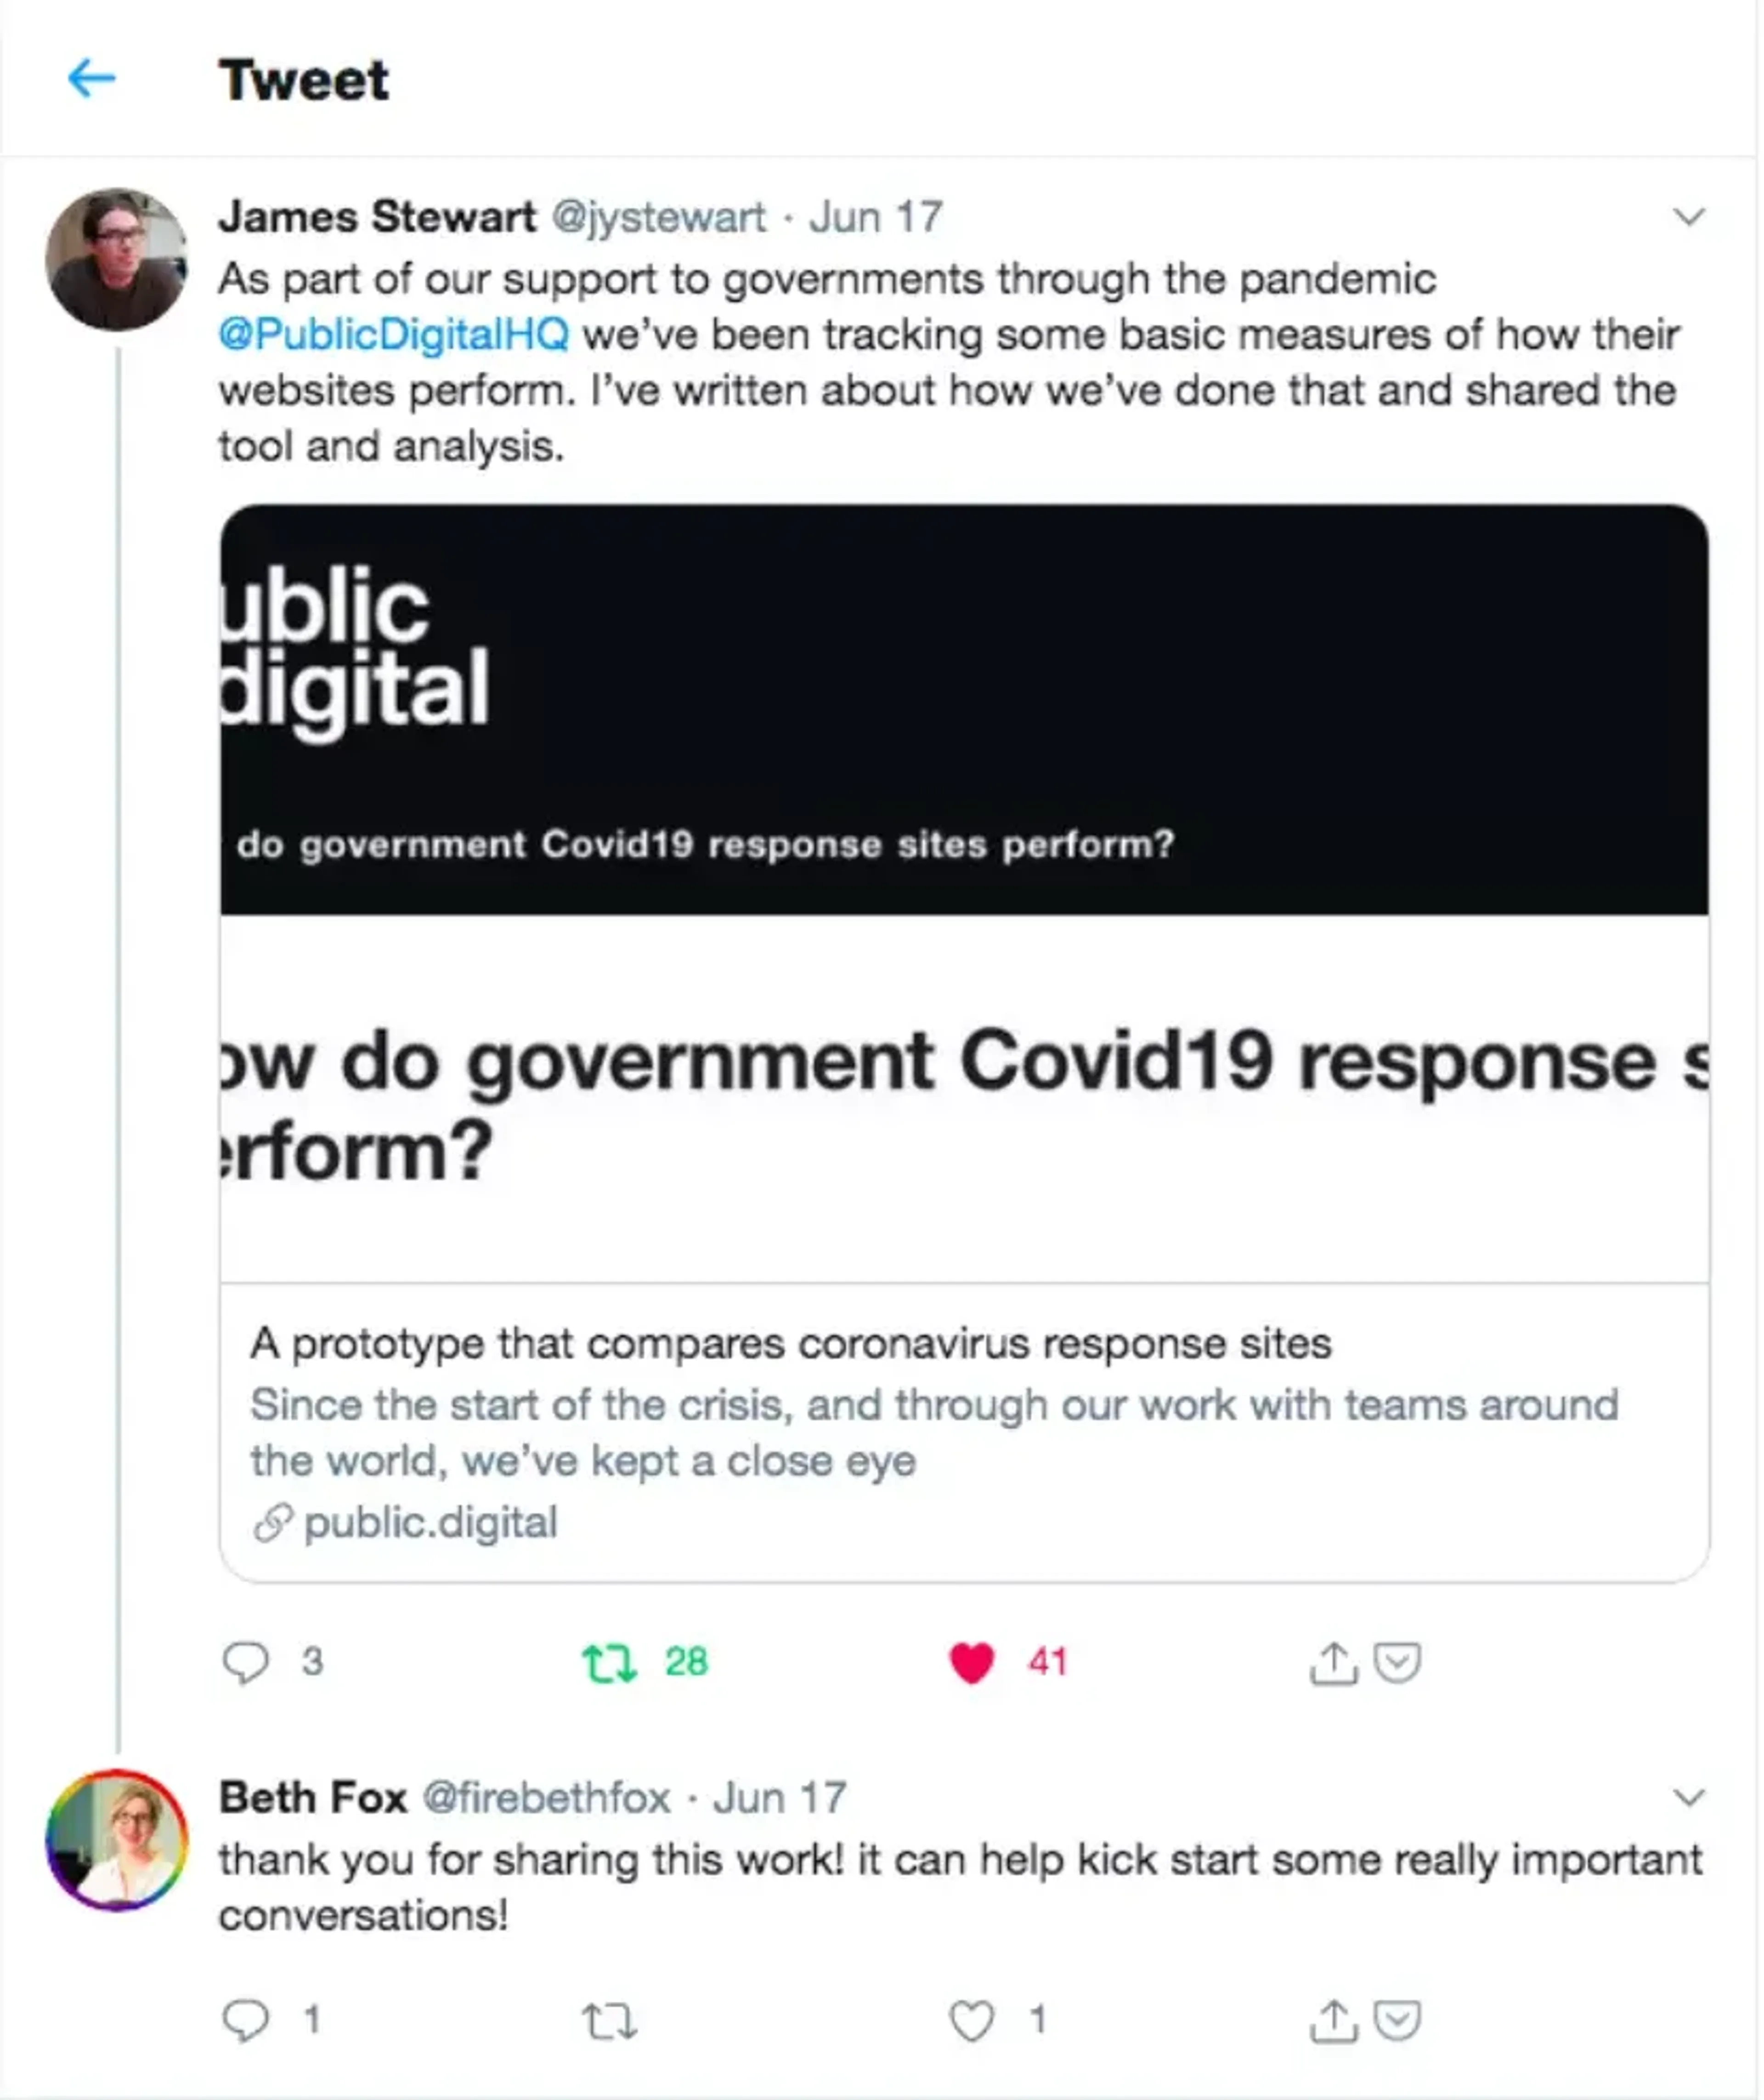
We recently launched a prototype Covid19 sites tracker. Thank you to everyone who’s sent feedback following our blog post.
It’s been great to see the mix of positive feedback and constructive criticism. In particular, it’s been encouraging to hear anecdotes about the conversations it’s triggered, and to hear from teams who are already doing work to improve on these metrics.
We thought it would be helpful to follow up with some notes on what we’ve changed since launch, why we started where we did, and how the underlying system works.
Including meaningful information on reading age is difficult
The topic that got most attention was our inclusion of reading age as a measure. We’d made several mistakes there.
First up, we’d used the US school grade scale to present the results. For those who spend time thinking about language clarity it’s a familiar scale, but it’s not as easily explained as a percentage or a number between 0 and 1 like our other measures.
Secondly, there are a number of Covid response sites that the code we used to determine reading age struggled with. It sometimes struggled to distinguish the meaningful content on a page from the standard header, footer, and navigation. It struggled with several languages. And there’s a substantial difference between those pages that are solely a list of links to other resources, and those that provide immediate content.
Thirdly and most importantly, there are strong reasons to question the validity of any standardised readability measurement like this. Thanks to Caroline Jarrett for sharing an article she and Ginny Redish wrote on readability formulas. Thanks too to the UK NHS team who shared their service manual advice on using a readability calculator. We think the message there is that such tools are helpful for teams who can bring a broader perspective to use on them but that we should be cautious.
So unless we can come up with a better way of measuring and comparing language complexity, we’re going to leave those scores out of the main report. If you’re determined, you can find them still recorded in github – here are the results for 22 June.
This is a prototype. We could have been clearer about that
We also weren’t clear enough that this is a prototype and that a good score simply shows you’re covering some basics – it does not conclusively mean that your response site meets user needs. Most people took it in the spirit it was intended, but if they went straight to the site and didn’t see the blog post first it might not have been clear.
As a step toward fixing that, we’ve added a banner at the top of each page identifying it as a prototype and linking back to the blog post. We’ve also added an explanatory paragraph on each page about the scale of the results (1 = great, 0 = awful) and used that as a chance to remind visitors that scoring well just means you have a good foundation so you can now focus on understanding and meeting the needs of your users.
Why these governments? We had to start somewhere
The list of governments we covered started with Tom’s blog post a couple of months ago and others mentioned in the comments there. It skews toward national governments, as well as toward Europe, North America, Latin America and Australia as that’s where Public Digital has been most active. We’ll try to fill in the gaps there, particularly for Africa and Asia, but trying to stretch this prototype to all levels of government, worldwide, would definitely break it.
In many places local governments are at the forefront of the response to the pandemic, but we suspect state and national-level governments are more likely to be peoples’ first port of call to get advice and information. It would be great to see some proper studies of that, and it opens up a variety of questions about how those responses could be better coordinated.
For now, if there’s a government site you think we should add, email covidsites-feedback@public.digital, or send a github pull request and we’ll add it in.
And how does it work?
Naturally, quite a few people wanted to know how it all works. Rather than answer that here, we’ve improved the documentation over on github. Feel free to open a github issue if you have any more detailed technical questions.
What’s next
We’re going to leave the site up for a while longer and we’ll continue to iterate it when we can based on ideas and feedback – we’re still keen to hear what people think. As some of the feedback pointed out, there’s interest in using the site to see how other non-Covid-related sites perform. The prototype measures and compares performance, not content, so there’s potential here.
If we look into it, we’ll keep you updated.
